I recently got into a discussion about dogs, kennels and temeratures. I have a German Shepherd, and he has a nice insulated dog house in his kennel, and the discussion was along the lines, how much heat does it take to warm up the doghouse, if it gets hotter than the outside at all.
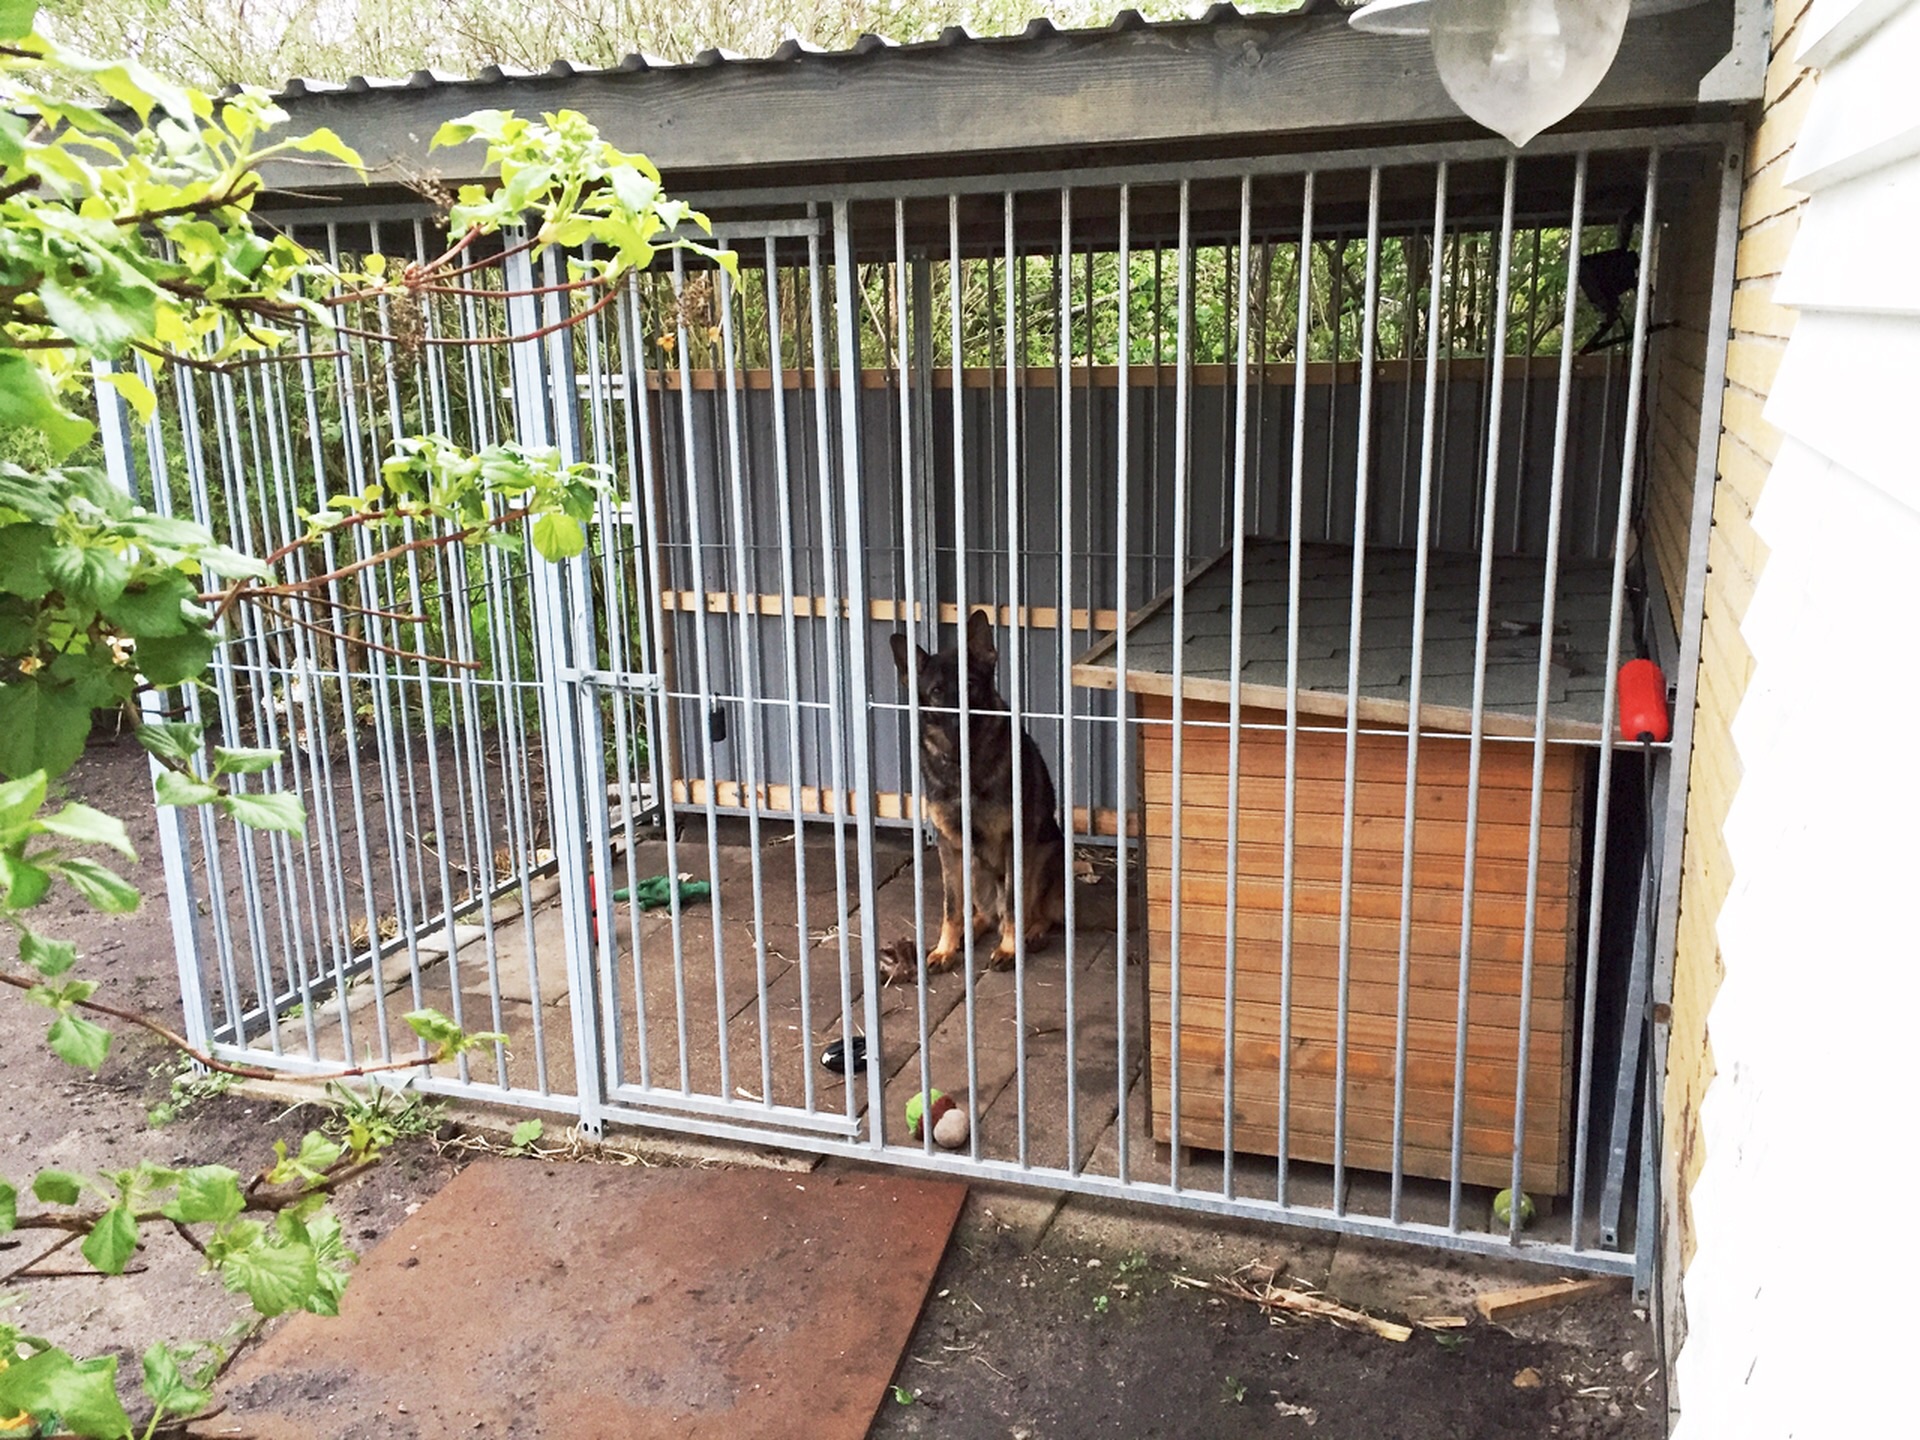
Now, a normal person would have solved this by putting a wireless meat thermometer in the doghouse, made a few readings of it with/without the dog, and compare it to the outside temperature.
I’m not normal!
Hardware
I dug out a spare RPi B+ i had lying around, and ordered a couple of waterproof DS18B20 digital one-wire thermometers, one for outside the doghouse, one for inside, and i started soldering. The nice thing about the DS18B20 is that you can connect multiple of them in parallel to the same bus.
There are plenty of tutorials on how to connect the DS18B20 to the RPi, so i won’t go into detail on how to do that.
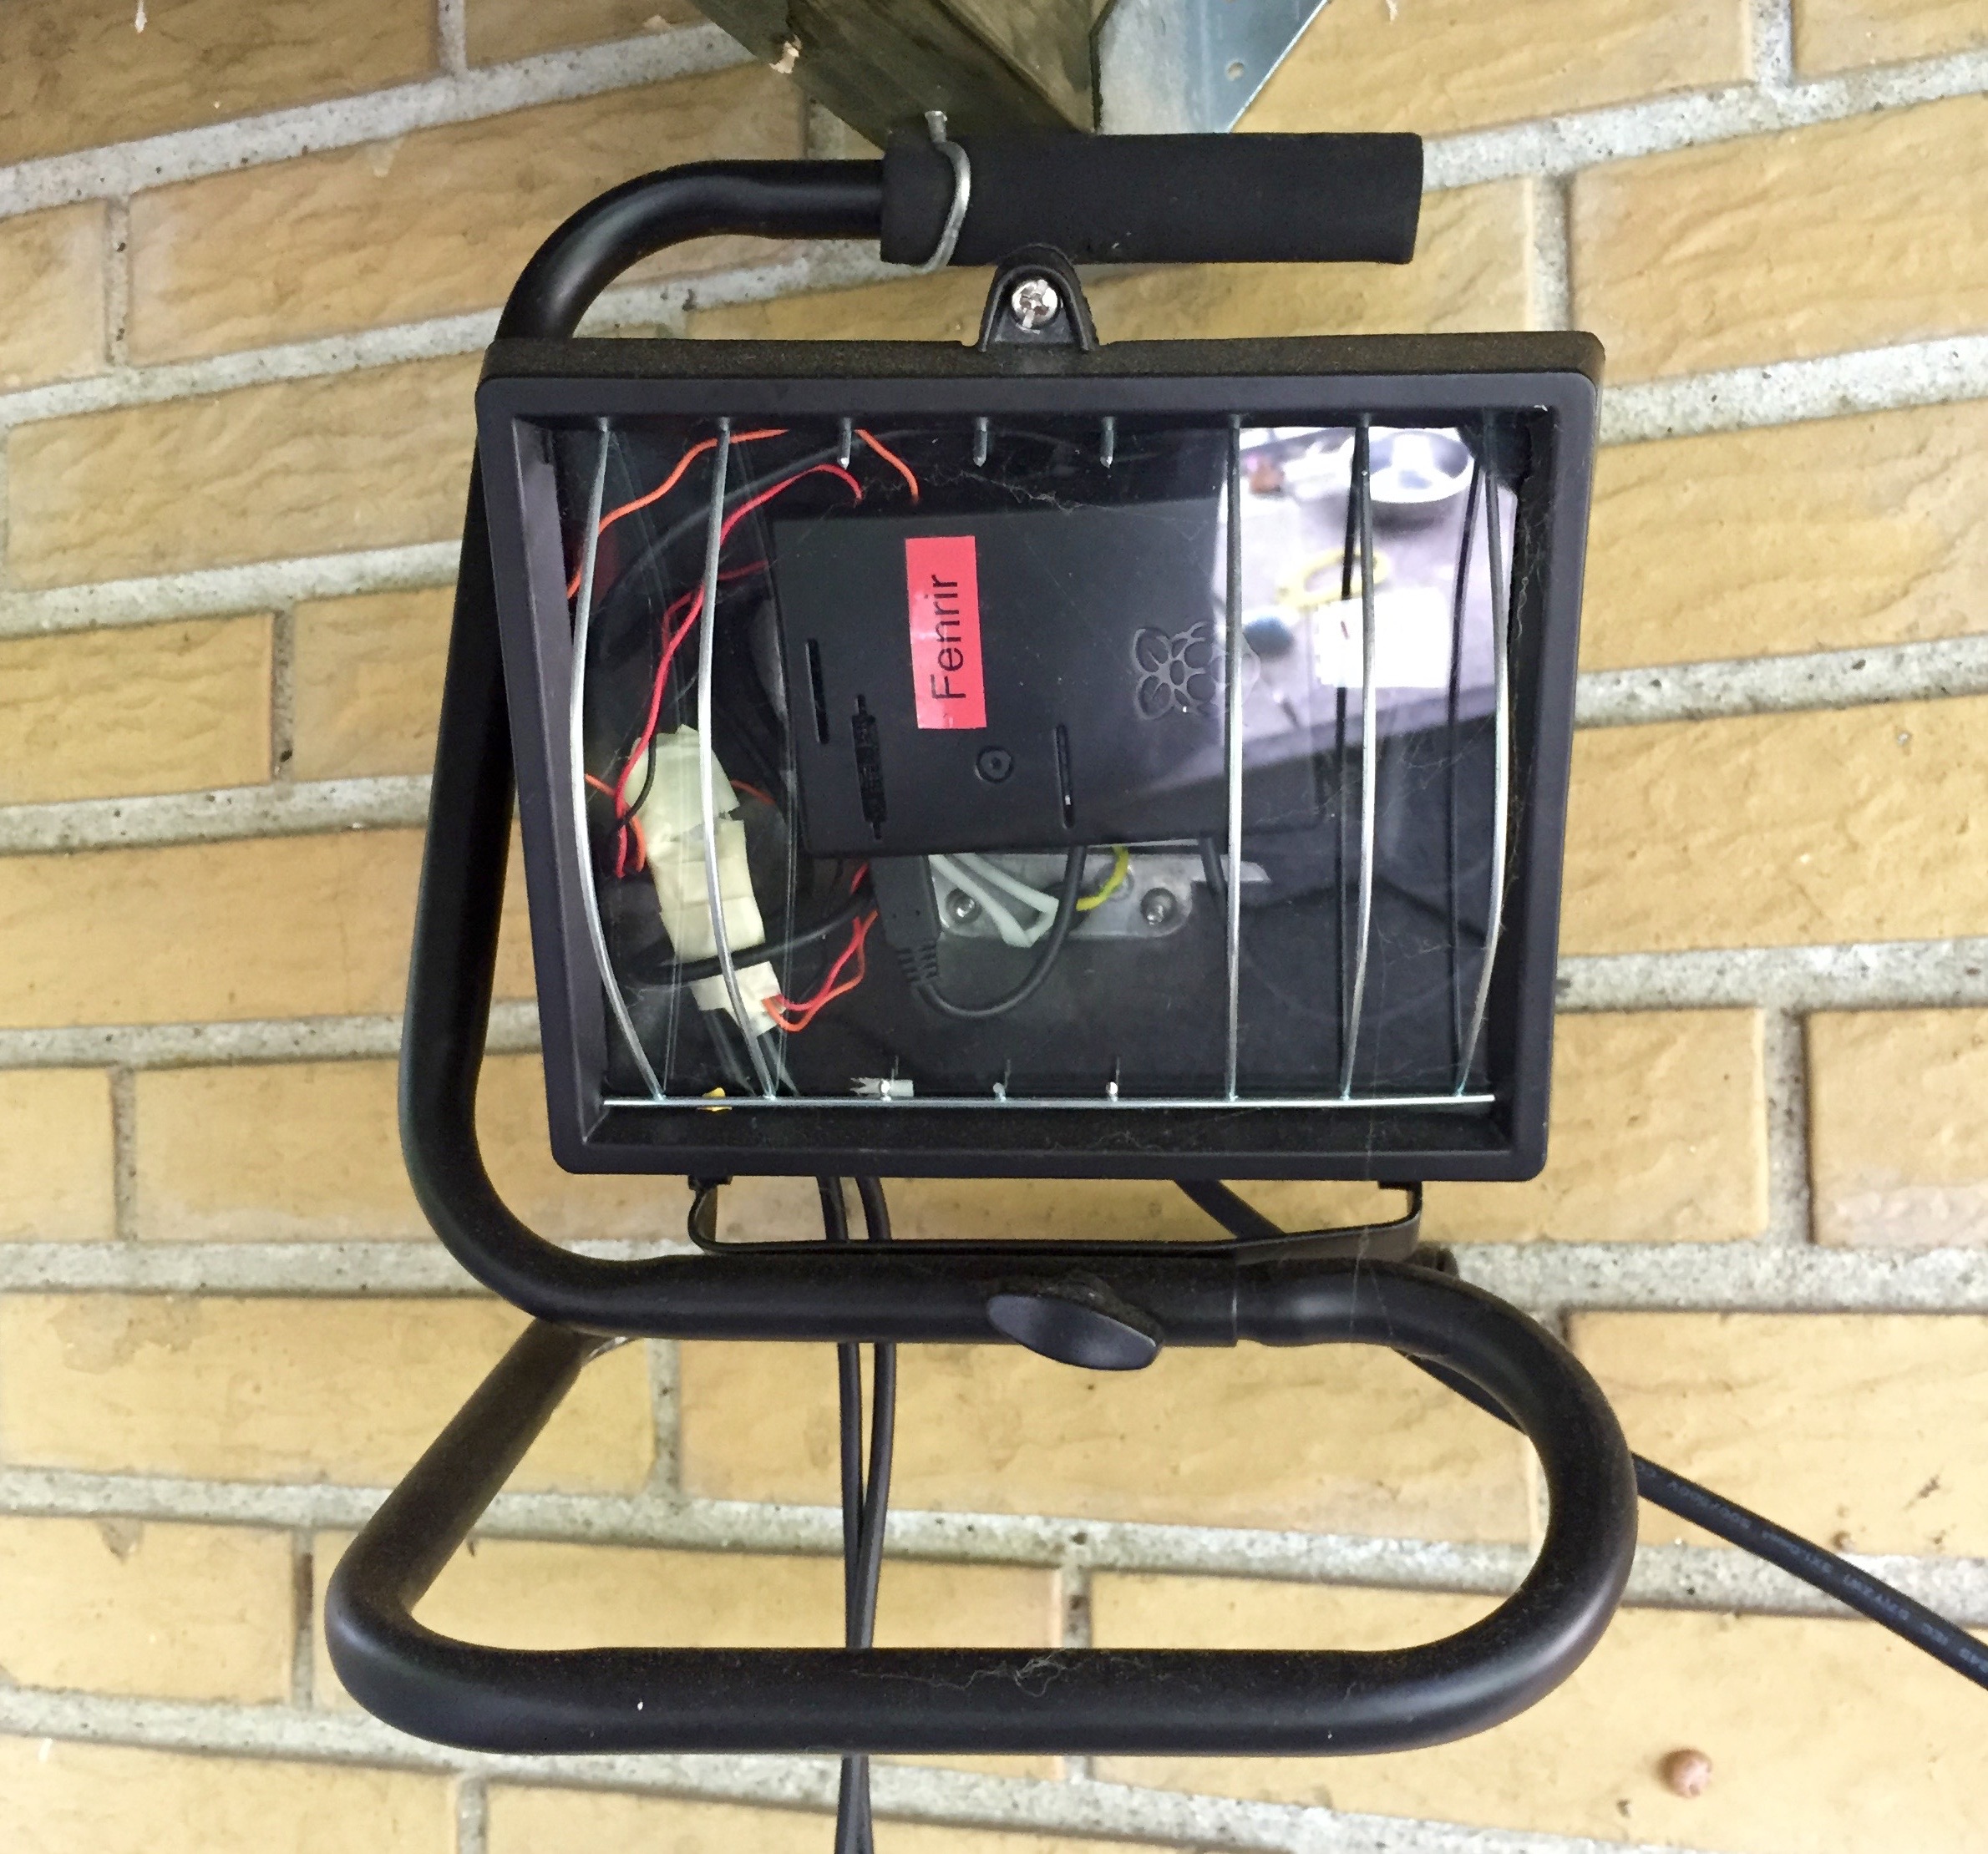
I also needed a casing for mounting the RPi in the kennel, and after searching the web for hours, i had an idea - floodlights are “waterproof”, as in rainproof, and they’re like $10, and come with a nice 230V waterproof wire attached.
Software Setup
I opted for the standard Raspbian image, and went throught the setup procedure.
As of the January raspbian image, the Device Tree is enabled by default, which requires an overlay to be configured in /boot/config.txt
dtoverlay=w1-gpio,gpiopin=4
For messaging i use MQTT which is easy to setup, and performs well. I’ve described my MQTT setup in another post.
After a reboot, the digital thermometers show up under /sys/bus/w1/devices/28-*, and the current reading is available for each device, in the w1_slave file
    70 01 55 00 7f ff 0c 10 7d : crc=7d YES
    70 01 55 00 7f ff 0c 10 7d t=23000
Monitoring Software
After configuring the hardware, it was time to write some actual software to run on the RPi devices.
Since the requirements for the projects were fairly low, I wrote the software in Python.
For the clients, i wrote a quick python script to read the temperature every xx seconds, and post a message via MQTT. The script also captures a snapshot via the RPi camera every 2 minutes, if one is present, which is also sent via MQTT.
On the server, another python script listens for incoming messages, and updates a RRD database, and in turn generates some nice graphs every 5 minutes.
The server also generates a timelapse video of the surveillance images for the previous day.
As for the website, i borrowed heavily from another project rrdture.
I put the monitoring software on GitHub
Brass knobs and more
After finishing the basic functionality, i started adding features. I have high/low temperature warnings, which alerts me via Pushover when the temperature reaches a configurable threshold, currently -10C and 28C.
The spotty WiFi connection also caused me to implement monitoring on the server to alert me whenever the clients fail to checkin for an hour or so.
Having used the Astral module for drawing dusk/dawn on my RRD graphs, i used it to stop image surveillance during the night, which would normally just result in a series of black images.
In time i will implement motion detection, and only capture a reference image every 2 minutes, with higher speed during times of motion.
Finished project
As for the current state of the project, everything is running nicely, although my WiFi connection is a bit spotty at times. I briefly tried posting MQTT messages with persistence, which in turn caused my RPi to crash because it ate up all available memory.
I have a couple of spare Powerline Extenders, so I’m considering putting those to good use by plugging them into the RPi. Another solution might be an outdoor WiFi access point, kinda like the UniFi AP Outdoor, which would probably also take care of our spotty WiFi signal outside the house.
And to answer to the temperature question, the average temperature inside the doghouse is about 1C lower than the outside temperature (the missing points are due to my WiFi connection stalling).
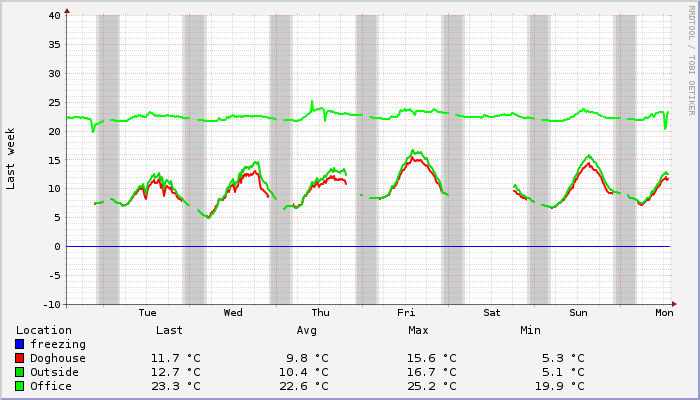
As for the temperature with the dog inside ? nobody knows yet. Shortly after i finished the project, spring hit, and the dog started staying outside the doghouse, so i guess i’ll have to wait until next winter to figure that one out :)